Nobabies.net
Contact me at info@nobabies.net. Do be patient.
AND THEN
Here are the major links:
Here are the papers.
Here are the summaries.
Here is the source code:
Source code for kinship and fertility part 1
Source code for kinship and fertility part 2
Source code for kinship and fertility part 3
Source code for kinship and fertility part 4
I have begun putting up talks on YouTube
YouTube links
YouTube video scripts March 6, 2018 and updates expected.
Here you may begin looking for Wild Surmise, beginning with wildsurmises.com.
Below are articles:
Open letter to Alexey Komov June 4, 2019
Show 46 Prophesy 4 Famine.
KJV
Revelation 6:
8 And I looked, and behold a pale horse: and his name that sat on him was Death, and Hell followed with him. And power was given unto them over the fourth part of the earth, to kill with sword, and with hunger, and with death, and with the beasts of the earth.
Famine is all too real. Through one filter the news is dominated by a contest between big money and big government. Some say they are the same thing. Through another filter the debate is between globalism and populism cum retraditionalization. Nobody wants famine. The Nazi’s arguably were driven by big money, while the communists were driven by big government. Both led to disaster. Stalin murdered more people than did Hitler, although that is rarely mentioned. The death rate under Mao Tse-tung, as we then called him, was higher. But they were not murders. The Red Chinese as communists broke up the little farms of China and rolled them up into huge communes, which were unable to raise enough food for the population, and people starved.
These prophesy programs are a thinly disguised effort to draw in enough traffic so that the issue of outbreeding infertility gains public recognition. The most popular shows seem to be hate-centered and fear-centered. I strive for neither. Although I do not understand people, I hate nobody. And instead of fear I want to induce curiosity.
Now there are those who expect famine on a dreadful scale. Here is a link:
https://electroverse.net/chinese-vegetable-prices-hit-record-highs-the-result-of-brutal-cold-spells-and-record-rainfall/
The mechanism invoked here is variability of solar output. There is no doubt that climate change has happened in the past. There were the Younger Dryas event, the Medieval Warm Period and the Mini Ice Age, for instances. The argument is that the solar energy output goes through cycles, in fact a number of them, and they are all adding up to simultaneous lows starting this year or next. I take that seriously enough to have started a bit of a garden:
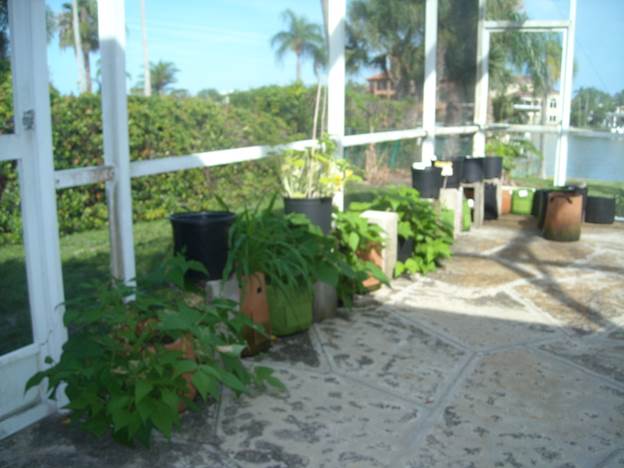
You might say that if nothing happens the garden will be too big, and if something happens the garden will be too small.
China
Although the link predicts dire things for China, the US Department of Agriculture does not raise a lot of concern, viz (sorry I don’t have a link)
MY2019/20 Grain for Food Use Situation and Outlook MY2019/20 wheat production is forecast at 131.5 MMT, slightly higher than MY2018/19 on higher yields. MY2019/20 rough rice production is forecast at 207.1 MMT, down 5 MMT from USDA’s April estimates for MY2018/19, on slightly lower harvested area and lower yields. To manage trade policy uncertainty, grain end users have shifted their buying patterns to alternative origins, revised the formulation of their products, and lowered their throughput volumes. 3 Chinese demand for higher grades of wheat and rice continues to grow as high- and middle-income consumers in first-tier cities continue to shift to greater consumption of convenient and healthy foods. Meanwhile, consumption of common wheat and rice are beginning to show signs of stabilizing as overall weakening economic conditions, and inflationary pressures in major cities, pressure lower income consumers to either “downgrade consumption” by reverting to consumption of “staple foods” such as instant noodles, or move to smaller cities where rice consumption is higher. MY2019/20 total wheat consumption is forecast slightly lower at 124 MMT, down 1 MMT from USDA’s April estimate for MY2018/19, on lower feed use. MY2019/20 wheat imports are forecast at 3.5 MMT, unchanged from USDA’s April estimates for MY2018/19. MY2019/20 rice consumption is forecast at 145 MMT, unchanged from USDA’s April estimate. Recent revisions to wheat and rice standards are expected to improve China’s management of temporary reserve stocks by lowering overall procurement volumes, and start a restructuring process to liquidate massive government stocks which overhang the domestic and global wheat and rice markets.
India
Rice looking good: https://www.world-grain.com/articles/11776-india-forecast-to-harvest-record-rice-crop
Cannot find references:
Agriculture, with its allied sectors, is the largest source of livelihoods in India. 70 percent of its rural households still depend primarily on agriculture for their livelihood, with 82 percent of farmers being small and marginal. In 2017-18, total food grain production was estimated at 275 million tonnes (MT). India is the largest producer (25% of global production), consumer (27% of world consumption) and importer (14%) of pulses in the world. India's annual milk production was 165 MT (2017-18), making India the largest producer of milk, jute and pulses, and with world's second-largest cattle population 190 million in 2012.[153] It is the second-largest producer of rice, wheat, sugarcane, cotton and groundnuts, as well as the second-largest fruit and vegetable producer, accounting for 10.9% and 8.6% of the world fruit and vegetable production, respectively.
However, India still has many growing concerns. As the Indian economy has diversified and grown, agriculture's contribution to GDP has steadily declined from 1951 to 2011. While achieving food sufficiency in production, India still accounts for a quarter of the world’s hungry people and home to over 190 million undernourished people. Incidence of poverty is now pegged at nearly 30 percent. As per the Global Nutrition Report (2016), India ranks 114th out of 132 countries on under-5 stunting and 120th out of 130 countries on under-5 wasting and 170th out of 185 countries on prevalence of anaemia. Anaemia continues to affect 50 percent of women including pregnant women and 60 percent of children in the country.
US
Here are some links. Everyone has seen reports of flooding and late season cold in the Midwest. But these sources do not seem to predict a catastrophe.
https://www.ers.usda.gov/webdocs/publications/37806/8679_oce101_1_.pdf?v=0
https://www.agriculture.com/news/business/10-predictions-for-farmers-in-2019
Less corn https://www.agriculture.com/news/business/us-corn-crop-could-be-smallest-since-2012-drought
Bad weather https://www.agriculture.com/news/business/mapping-out-cold-wet-june
Russia
I had been thinking that it would be up to Russia to feed the world, but the Grand Solar minimum people think otherwise:
Forecast agricultural output 2019 not so hot https://electroverse.net/russias-2019-20-wheat-production-forecast-to-fall/
On the other hand Ukraine production of wheat seems to be promising.
World
For the Grand Solar minimum, world food production 2018
Looks bleak, https://electroverse.net/nasa-predicts-next-solar-cycle-will-be-lowest-in-200-years-dalton-minimum-levels-the-implications/
But if you want a rosy outlook go back to the USDA
https://www.usda.gov/media/blog/2019/05/17/abundant-supplies-are-forecast-coming-crop-year-us-and-around-world
And world food production forecast 2019
Not so bad. https://apps.fas.usda.gov/psdonline/circulars/production.pdf
Now it does seem that there is a French heat wave https://www.youtube.com/watch?v=j2U-LYAh8A0 I suppose that weights against the Grand Solar Minimum.
On the other hand, remember the map of the Arctic Ice Cap I showed earlier:
Don’t forget this is for educational purposes only. I encourage you to visit them at https://nsidc.org/arcticseaicenews/
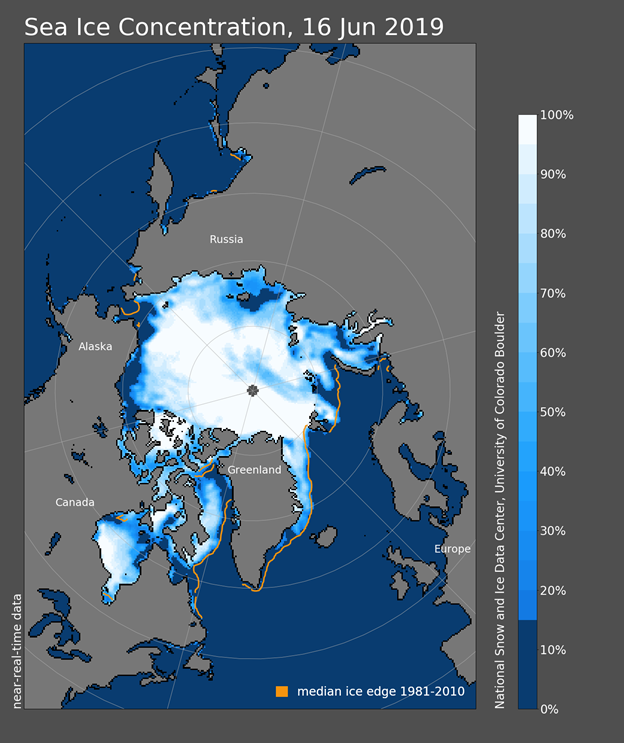
Here it was yesterday:
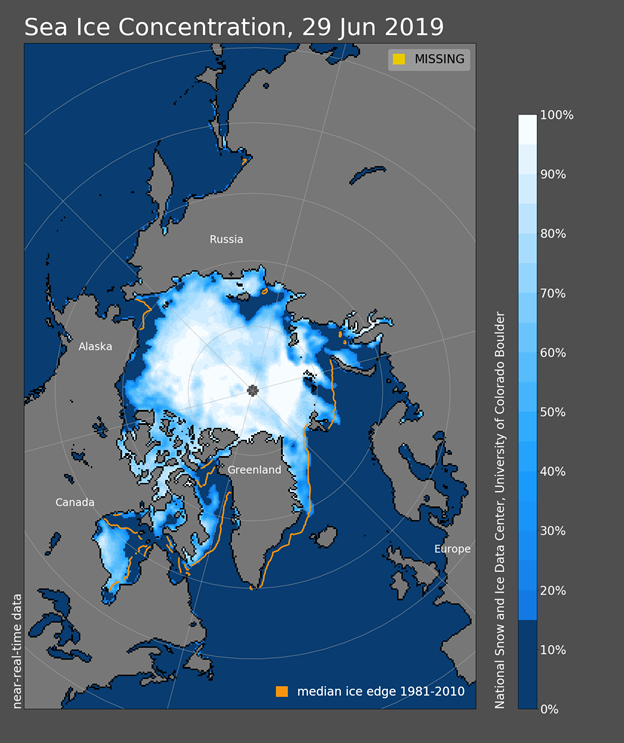
The blue means over 15% cover; I think of it like a bowl of water with ice cubes over the top. Look how much more broken ice there is within 100 miles of the North Pole. (The distance from the Pole to the north of Greenland is about 500 miles.) Also notice that there are only about 200 miles of solid ice between the Pole and land. When that breaks, the ice cap will be adrift for the first time. I have no idea where it will go, but things might get different. That much change in roughly two weeks, and there are almost 3 more months of summer.
YouTube video scripts
Home page.